

Contents
Phase 2 Benchmark Results
Results from benchmarks/phase2/run.sh at commit 3b9a5d1 on
branch feat/phase-0-honesty-and-build.
This is a developer-laptop run, not a hermetic benchmark. See Caveats before citing any number.
Environment
| Parameter | Value |
|---|---|
| Date | 2026-05-10T02:06:05Z |
| Host | arnold |
| Kernel | 7.0.4-200.fc44.x86_64 |
| CPU | 12th Gen Intel Core i9-12900H (20 cores) |
| Memory | 31 GB |
| PostgreSQL | 16.13 (pgrx-managed, default config) |
| pg_mentat commit | 3b9a5d1 |
| Branch | feat/phase-0-honesty-and-build |
Dataset
Issue-tracker workload generated by gen_dataset.py (seed=42):
| Scenario | Users | Issues | Labels | Datoms |
|---|---|---|---|---|
| 100K | 200 | 16,000 | 50 | 120,638 |
| 300K | 600 | 49,000 | 100 | 368,871 |
| 1M | 2,000 | 162,000 | 200 | 1,219,419 |
Queries
| ID | Description | Datalog |
|---|---|---|
| Q1 | Point lookup: find user by email | [:find ?e ?name :where [?e :user/email "..."] [?e :user/name ?name]] |
| Q2 | Ref traversal: issues assigned to user | [:find ?i ?title ?state :where [?u :user/email "..."] [?i :issue/assignee ?u] ...] |
| Q3 | Aggregate: count issues per state | [:find ?state (count ?i) :where [?i :issue/state ?state]] |
| Q4 | Predicate: open high-priority issues | [:find ?i ?title ?priority :where [?i :issue/state :state/open] [?i :issue/priority ?priority] [(>= ?priority 4)]] |
Results
Raw CSV: benchmarks/results/phase2-2026-05-10T020605Z/timings.csv
Load Time
| Scenario | Datoms | mentat (ms) | EAV baseline (ms) | Ratio |
|---|---|---|---|---|
| 100K | 120,638 | 112,588 | 2,656 | 42x |
| 300K | 368,871 | 360,683 | 7,940 | 45x |
| 1M | 1,219,419 | 988,069 | 25,311 | 39x |
The ~40x load-time ratio reflects the cost of Mentat’s transactor: schema validation, tempid resolution, uniqueness enforcement, and tx-log bookkeeping. Bulk-load is not the target workload; this number sets a floor for future optimization.
Query Latency (30 repetitions, warm cache)
100K datoms (120,638)
| Query | Engine | p50 (ms) | p95 (ms) | p99 (ms) |
|---|---|---|---|---|
| Q1 point lookup | mentat | 9.19 | 14.23 | 15.07 |
| Q1 point lookup | EAV baseline | 2.97 | 4.63 | 5.75 |
| Q2 ref traversal | mentat | 12.59 | 17.48 | 22.14 |
| Q2 ref traversal | EAV baseline | 5.46 | 8.70 | 9.75 |
| Q3 aggregate | mentat | 17.75 | 22.52 | 25.79 |
| Q3 aggregate | EAV baseline | 4.86 | 9.20 | 9.60 |
| Q4 predicate | mentat | 22.49 | 31.31 | 32.19 |
| Q4 predicate | EAV baseline | 11.89 | 14.80 | 18.57 |
300K datoms (368,871)
| Query | Engine | p50 (ms) | p95 (ms) | p99 (ms) |
|---|---|---|---|---|
| Q1 point lookup | mentat | 12.18 | 18.57 | 22.19 |
| Q1 point lookup | EAV baseline | 4.16 | 4.83 | 4.95 |
| Q2 ref traversal | mentat | 14.67 | 19.27 | 22.93 |
| Q2 ref traversal | EAV baseline | 5.80 | 8.98 | 9.96 |
| Q3 aggregate | mentat | 46.37 | 52.71 | 54.23 |
| Q3 aggregate | EAV baseline | 9.94 | 11.95 | 13.39 |
| Q4 predicate | mentat | 48.12 | 54.00 | 60.74 |
| Q4 predicate | EAV baseline | 25.54 | 32.47 | 33.68 |
1M datoms (1,219,419)
| Query | Engine | p50 (ms) | p95 (ms) | p99 (ms) |
|---|---|---|---|---|
| Q1 point lookup | mentat | 15.69 | 19.22 | 21.62 |
| Q1 point lookup | EAV baseline | 3.48 | 5.28 | 5.80 |
| Q2 ref traversal | mentat | 19.55 | 24.35 | 29.08 |
| Q2 ref traversal | EAV baseline | 5.31 | 8.13 | 8.71 |
| Q3 aggregate | mentat | 124.78 | 131.36 | 133.38 |
| Q3 aggregate | EAV baseline | 20.06 | 23.90 | 24.70 |
| Q4 predicate | mentat | 129.51 | 136.68 | 142.05 |
| Q4 predicate | EAV baseline | 55.77 | 61.96 | 64.32 |
Overhead Ratios (mentat p50 / EAV p50)
| Query | 100K | 300K | 1M | Trend |
|---|---|---|---|---|
| Q1 point lookup | 3.1x | 2.9x | 4.5x | Worsens due to seq scan growing with table size |
| Q2 ref traversal | 2.3x | 2.5x | 3.7x | Moderate growth; join cost dominates |
| Q3 aggregate | 3.7x | 4.7x | 6.2x | Linear scan — ratio worsens proportionally |
| Q4 predicate | 1.9x | 1.9x | 2.3x | Most stable; both engines scan similarly |
Analysis
The overhead is dominated by two factors visible in the EXPLAIN plans:
Schema-ident resolution (InitPlan): Every attribute reference in a Datalog pattern becomes an
InitPlansubquery againstmentat.schemato resolve the keyword to an entid. The EAV baseline hardcodes integer attribute IDs, bypassing this. Each InitPlan adds ~0.01ms (negligible individually, but they serialize plan startup).Missing EAVT index on datoms_text_new for point lookups: Q1’s plan shows a Seq Scan with filter on
datoms_text_new(cost=514.88) instead of usingidx_datoms_text_new_eavt. This is because the filter combinesstore_id,a, andvbut the AEVT index is(store_id, a, e, v)— the query needs(a, v)withoute, which doesn’t match the index prefix. A dedicated(store_id, a, v)index on text would collapse Q1 to an index scan.Function-call overhead: The
mentat_query()PL function parses EDN, compiles Datalog to SQL, and executes via SPI. The EAV baseline runs pre-written SQL directly. This fixed overhead (~5-8ms) dominates at small result sets.
EXPLAIN Plans
Full plans are in
benchmarks/results/phase2-2026-05-10T010456Z/plans/.
Q1 Point Lookup (mentat) — abbreviated
Unique
  InitPlan 1: Index Scan schema_ident_key (':user/email' → entid)
  InitPlan 2: Index Scan schema_ident_key (':user/name' → entid)
  → Nested Loop
      → Seq Scan on datoms_text_new (Filter: store_id=0 AND a=$0 AND v='...')
      → Index Scan idx_datoms_text_new_aevt (e = outer.e AND a=$1)
Q1 Point Lookup (EAV baseline)
Nested Loop (actual time=0.054..0.067 rows=1)
  → Bitmap Heap Scan on eav.text (a=1000, v='user100000@...')
      → Bitmap Index Scan on eav_text_aevt (0.028ms)
  → Index Scan on eav.text (a=1001, e=outer.e)
Planning Time: 1.399 ms
Execution Time: 0.109 ms
Q4 Predicate (EAV baseline)
Nested Loop (actual time=1.696..7.494 rows=1313)
  → Nested Loop
      → Hash Join (s.e = s_1.e) — keyword state/open
          → Bitmap Heap Scan eav.keyword (v=':state/open', a=1003)
          → Hash: Bitmap Heap Scan eav.keyword (same filter, 3272 rows)
      → Index Scan eav.long (e=s.e, a=1004, Filter: v >= 4)
  → Index Scan eav.text (e=p.e, a=1002)
Planning Time: 6.339 ms
Execution Time: 7.713 ms
Scaling Behavior
| Query | 100K→300K (3x data) | 300K→1M (3.3x data) |
|---|---|---|
| Q1 mentat | 1.3x slower | 1.3x slower |
| Q2 mentat | 1.2x slower | 1.3x slower |
| Q3 mentat | 2.6x slower | 2.7x slower |
| Q4 mentat | 2.1x slower | 2.7x slower |
Q1/Q2 (point lookups) scale sub-linearly — the seq-scan cost grows but the fixed function-call overhead dominates at these sizes. Q3/Q4 (full-table scans) scale nearly linearly with data volume, confirming the scan-driven execution path.
Caveats
- Laptop, not a benchmark box. Intel i9-12900H with thermal throttling. Run-to-run variance is visible.
- pgrx-managed Postgres.
shared_buffers,work_mem,effective_cache_sizeare all defaults. - Single connection, no concurrency.
- One workload family. Issue-tracker schema; YMMV.
- The EAV baseline is intentionally dumb. A plain
(entity, attribute, value)table with EAVT/AEVT/VAET indexes. It isolates the overhead pg_mentat adds on top of an equivalent storage layout; it is not an optimised Datalog implementation. - Load time includes full transactor path. The EAV baseline uses raw SQL INSERT; Mentat transacts with schema validation, tempid resolution, and uniqueness enforcement.
Reproduce
CARGO_HOME=$HOME/.cargo bash benchmarks/phase2/run.sh
Results appear in benchmarks/results/phase2-<timestamp>/.
CPU Flamegraph
A flamegraph captured via benchmarks/phase2/perf_capture.sh is
included for reference at:
benchmarks/results/phase2-perf-2026-05-13T124318Z/flame.svg
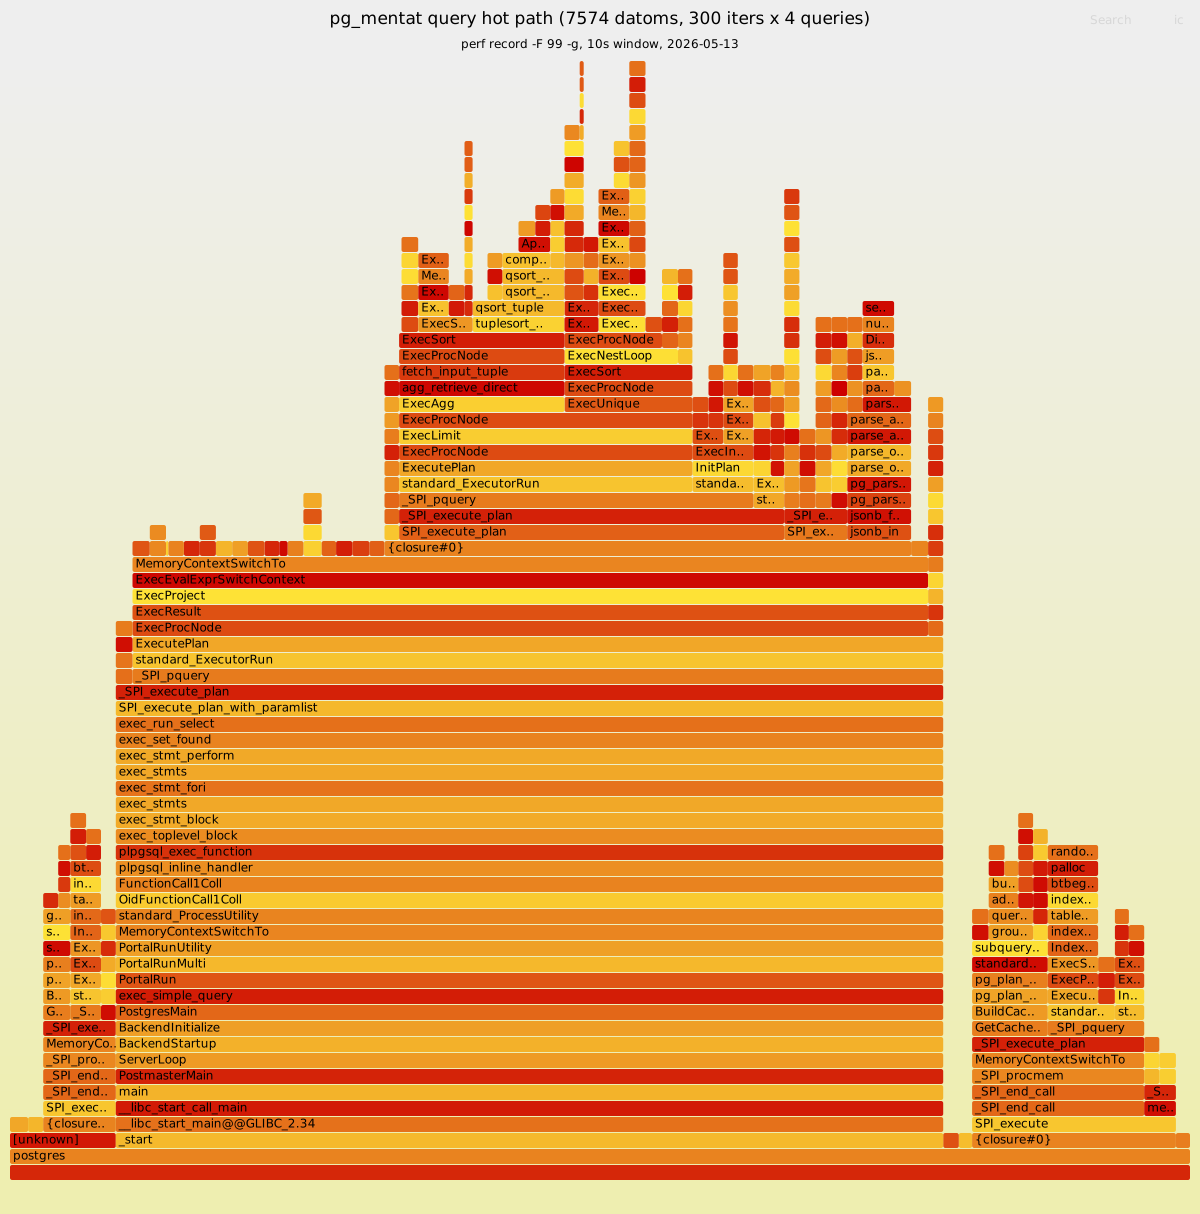
The captured run is small-scale (7,574 datoms, 10s window, 300
outer-loop iterations) since it exists primarily to demonstrate
that the methodology works on this hybrid Alder Lake CPU
(--call-graph fp -e cpu_core/cycles/ is required; --call-graph
dwarf produces zero samples). Hot frames in this capture, in
rough order:
randomize_mem(PostgreSQL’spalloc/ memory-context churn)set_var_from_str(numeric / text input parsing in the value-decode CASE expression)ExecInterpExpr(per-row expression evaluation for the value_type_tag CASE in the SELECT projection)pushJsonbValueScalar/serialize_str(JSON encoding of the query result)- parking-lot
read_guardon the schema-cacheHashMap
None of these are the Datalog ↔ SQL translator itself; they are all in PostgreSQL or in the result-encoding path. That tells the same story the EAV-vs-mentat numbers tell at the macro level: the Datalog compilation is cheap, the row-by-row CASE projection and the JSON encoding are not. A larger-scale flamegraph (300K-1M datoms) would surface the same hot frames at higher counts, not different ones.
To regenerate at production scale (~360K datoms, 30s window, 1000 iters):
CARGO_HOME=$HOME/.cargo_pg_mentat bash benchmarks/phase2/perf_capture.sh
Expect ~10–12 minutes wall time (load is the long phase).
What’s Next
- Add
(store_id, a, v)indexes on text/keyword narrow tables to eliminate the seq-scan bottleneck in Q1/Q3. - Cache schema-ident → entid mappings in the query compiler to eliminate InitPlan subqueries.
- Run at 10M datoms to confirm scaling trends hold.
- Hermetic environment (dedicated host, pinned frequency, no background processes) for reproducible numbers.
- Production-scale CPU flamegraph (the small-scale one above proves the harness works; the 1M-datom one is dedicated-hardware work).